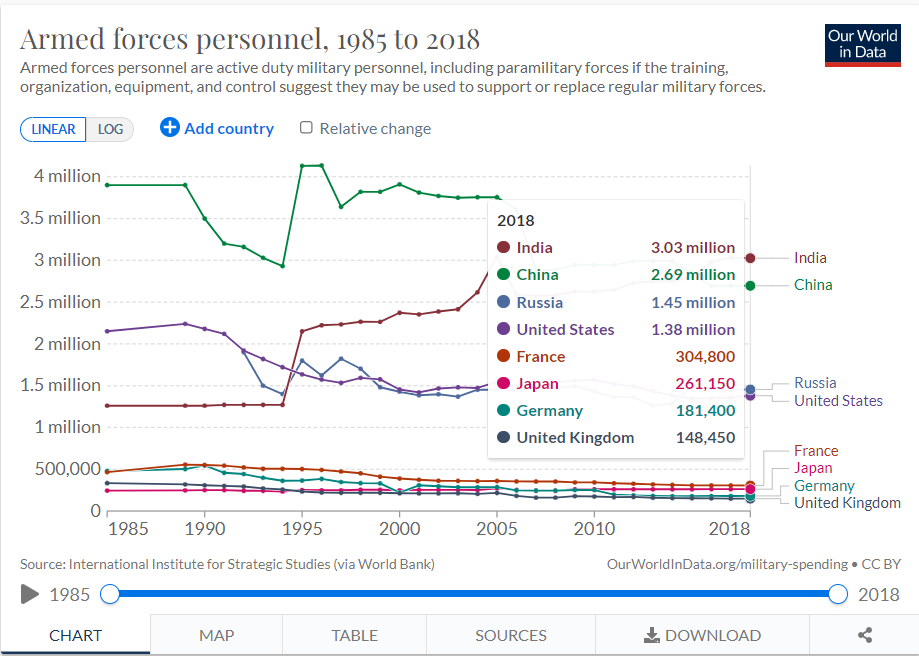
Since the war in Ukraine has been such an important and historical event, I chose to analyze data pertaining to the armed forces of different countries with data collected from 1895 to 2018.
This is the link to the data.
The following code chunk loads the package I will use to read in and prepare the data for analysis.
- Read the data in
- Use glimpse to see the names and types of the columns
glimpse(armed_forces_personnel)
Rows: 6,444
Columns: 4
$ Entity                          <chr> "Afghanistan", "Afghanistan"~
$ Code                            <chr> "AFG", "AFG", "AFG", "AFG", ~
$ Year                            <dbl> 1985, 1989, 1990, 1991, 1992~
$ `Armed forces personnel, total` <dbl> 47000, 55000, 58000, 45000, ~
#view(armed_forces_personnel)
- Use output from glimpse (and View) to prepare the data for analysis
-Create the object regions that is list of regions I want to extract from the dataset
-Change the name of 1st column to Country and the 4th column to Armed forces personnel
-Use filter to extract the rows that I want to keep: Year >= 1990 and Country in countries
-Select the columns to keep: Country, Year, Armed_Forces
-Use mutate to convert Armed forced personnel to millions
-Assign the output to armed_forces_per_country
-Display the first 9 rows of armed_forces_per_country
countries <- c("India",
               "International transport",
               "China",
               "Russia",
               "United States",
               "France",
               "Japan",
               "Germany",
               "United Kingdom" )

armed_forces_per_country <- armed_forces_personnel  %>%
  rename(Country = 1, Armed_Forces = 4)  %>%
  filter(Year >= 1990, Country %in%  countries)  %>%
  select(Country, Year, Armed_Forces)  %>%
  mutate(Armed_Forces = Armed_Forces * 1e-8)

armed_forces_per_country
# A tibble: 230 x 3
   Country  Year Armed_Forces
   <chr>   <dbl>        <dbl>
 1 China    1990       0.035
 2 China    1991       0.032
 3 China    1992       0.0316
 4 China    1993       0.0303
 5 China    1994       0.0293
 6 China    1995       0.0413
 7 China    1996       0.0414
 8 China    1997       0.0364
 9 China    1998       0.0382
10 China    1999       0.0382
# ... with 220 more rows
Check that the total for 2018 equals the total in the graph
I am adding the total of ALL countries total armed forces together. The summary should be similar to the armed forces per country added together for a grand total.
armed_forces_per_country  %>% filter(Year == 2018)  %>%
  summarise(total_personnel = sum(Armed_Forces))
# A tibble: 1 x 1
  total_personnel
            <dbl>
1          0.0945
Adding a picture
Write the data to file in the project directory
write_csv(armed_forces_per_country, file="armed_forces_per_country.csv")